 We offer a different ways to export your email analytics, allowing you to create custom reports and use your data across different platforms.
Export data from a chart
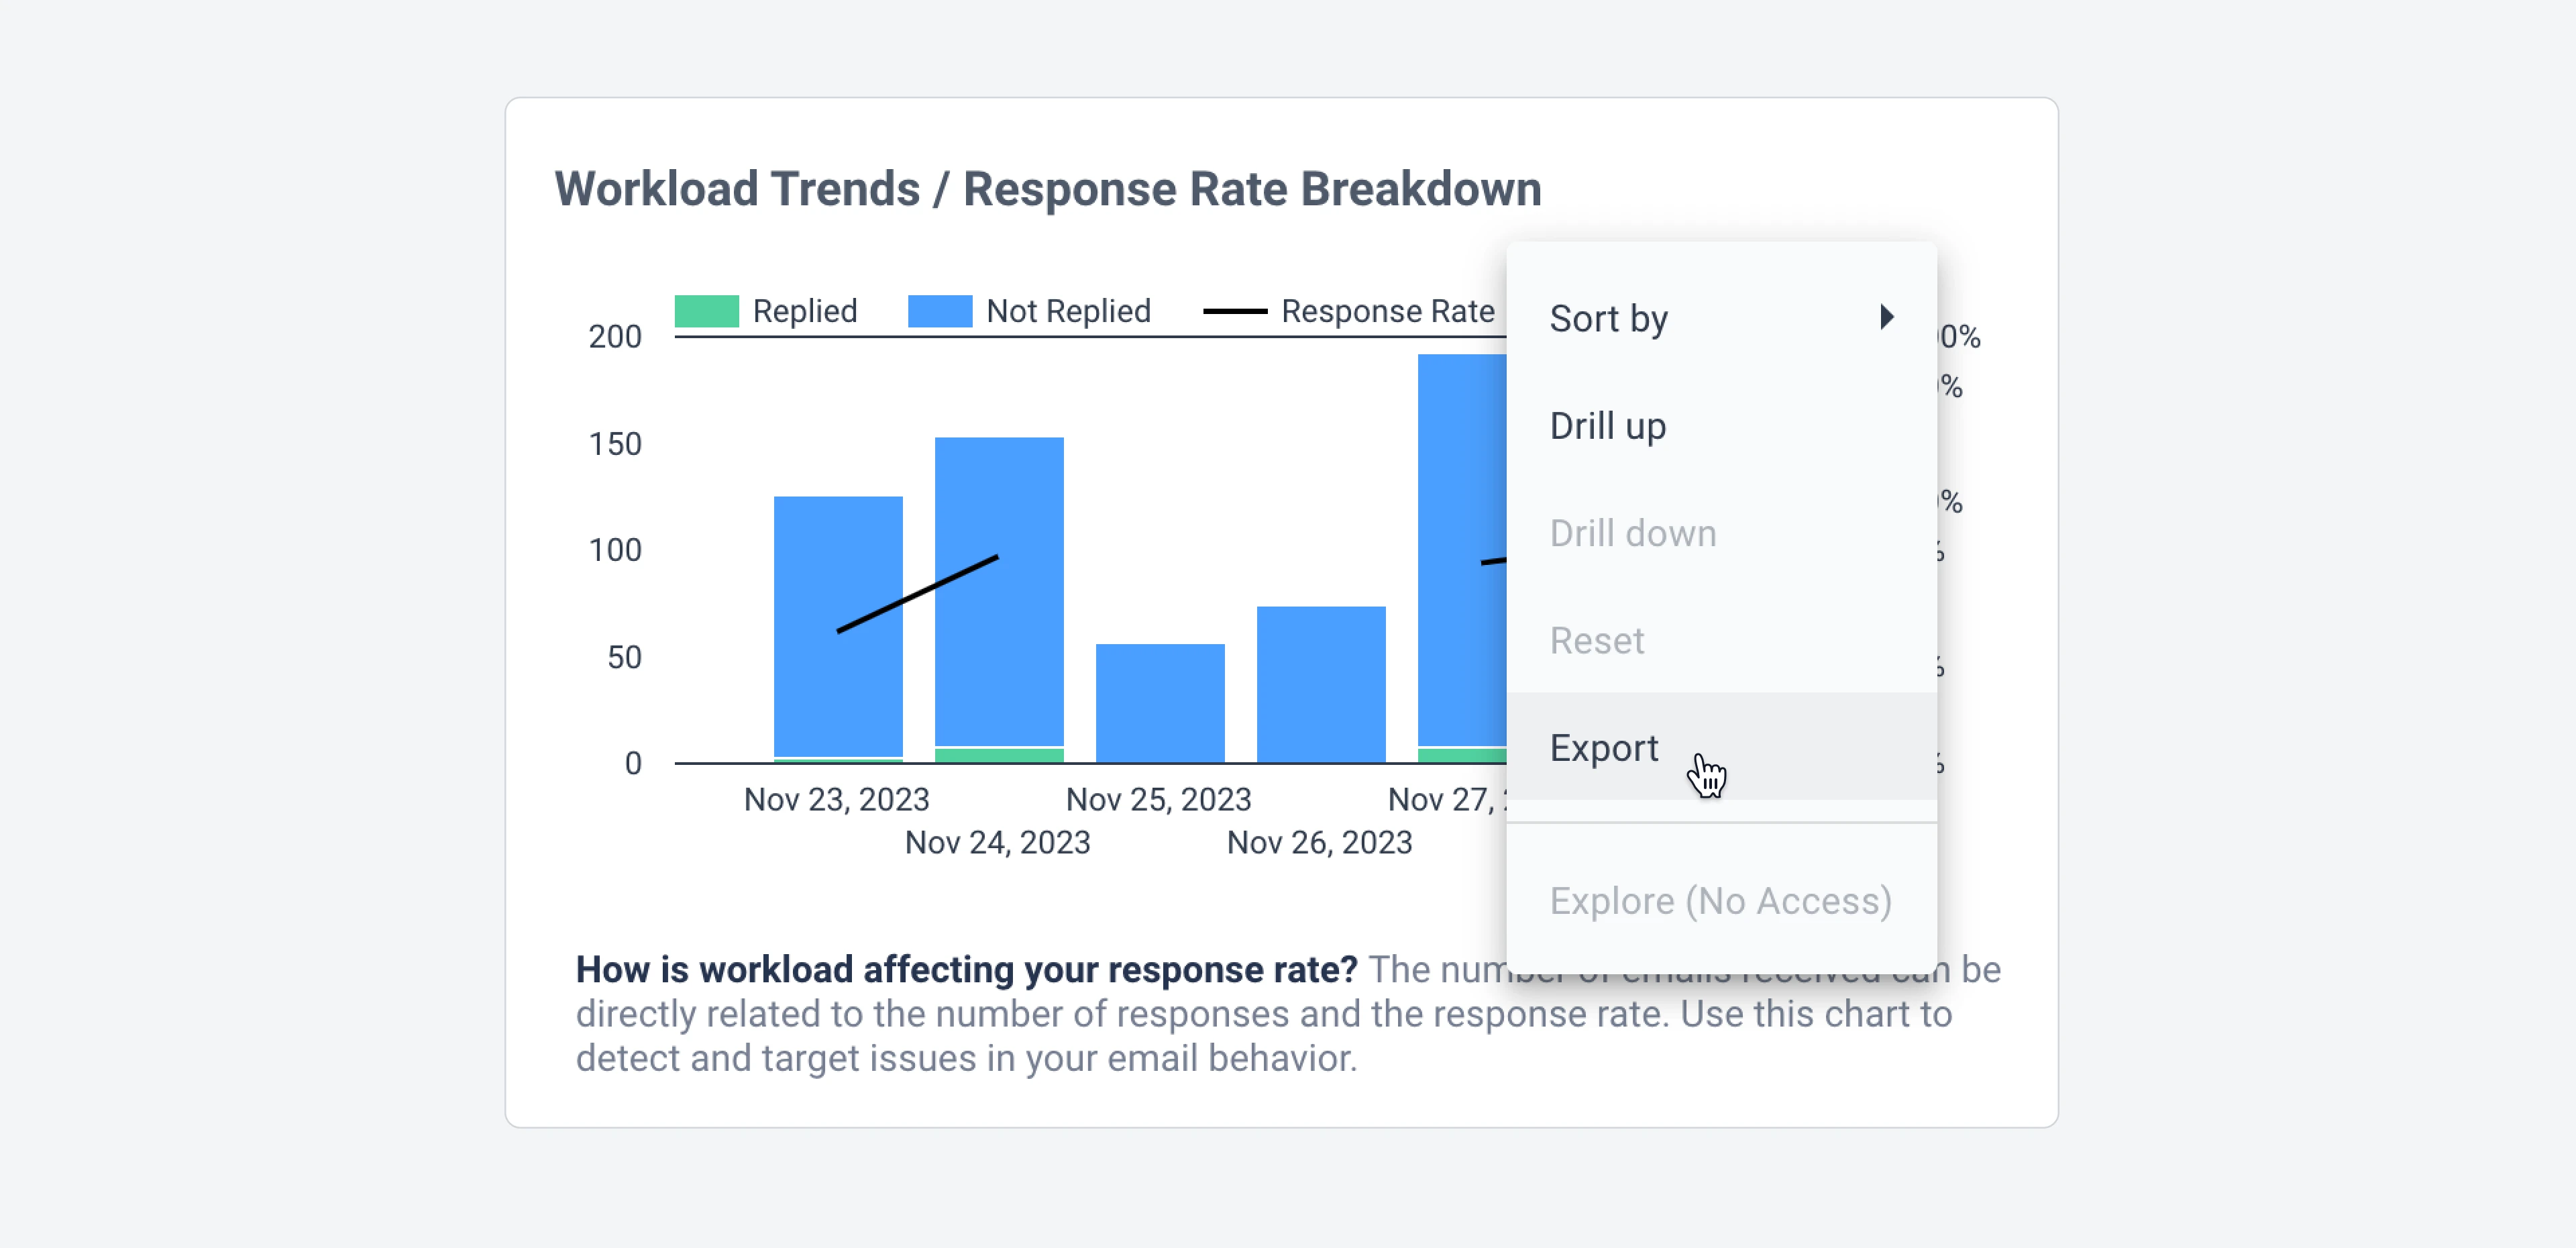
If you need to export information that is already presented in your dashboard, you can easily export it by hovering over the chart or table you wish to export, right-click or select the three dots icon··· and selecting Export.
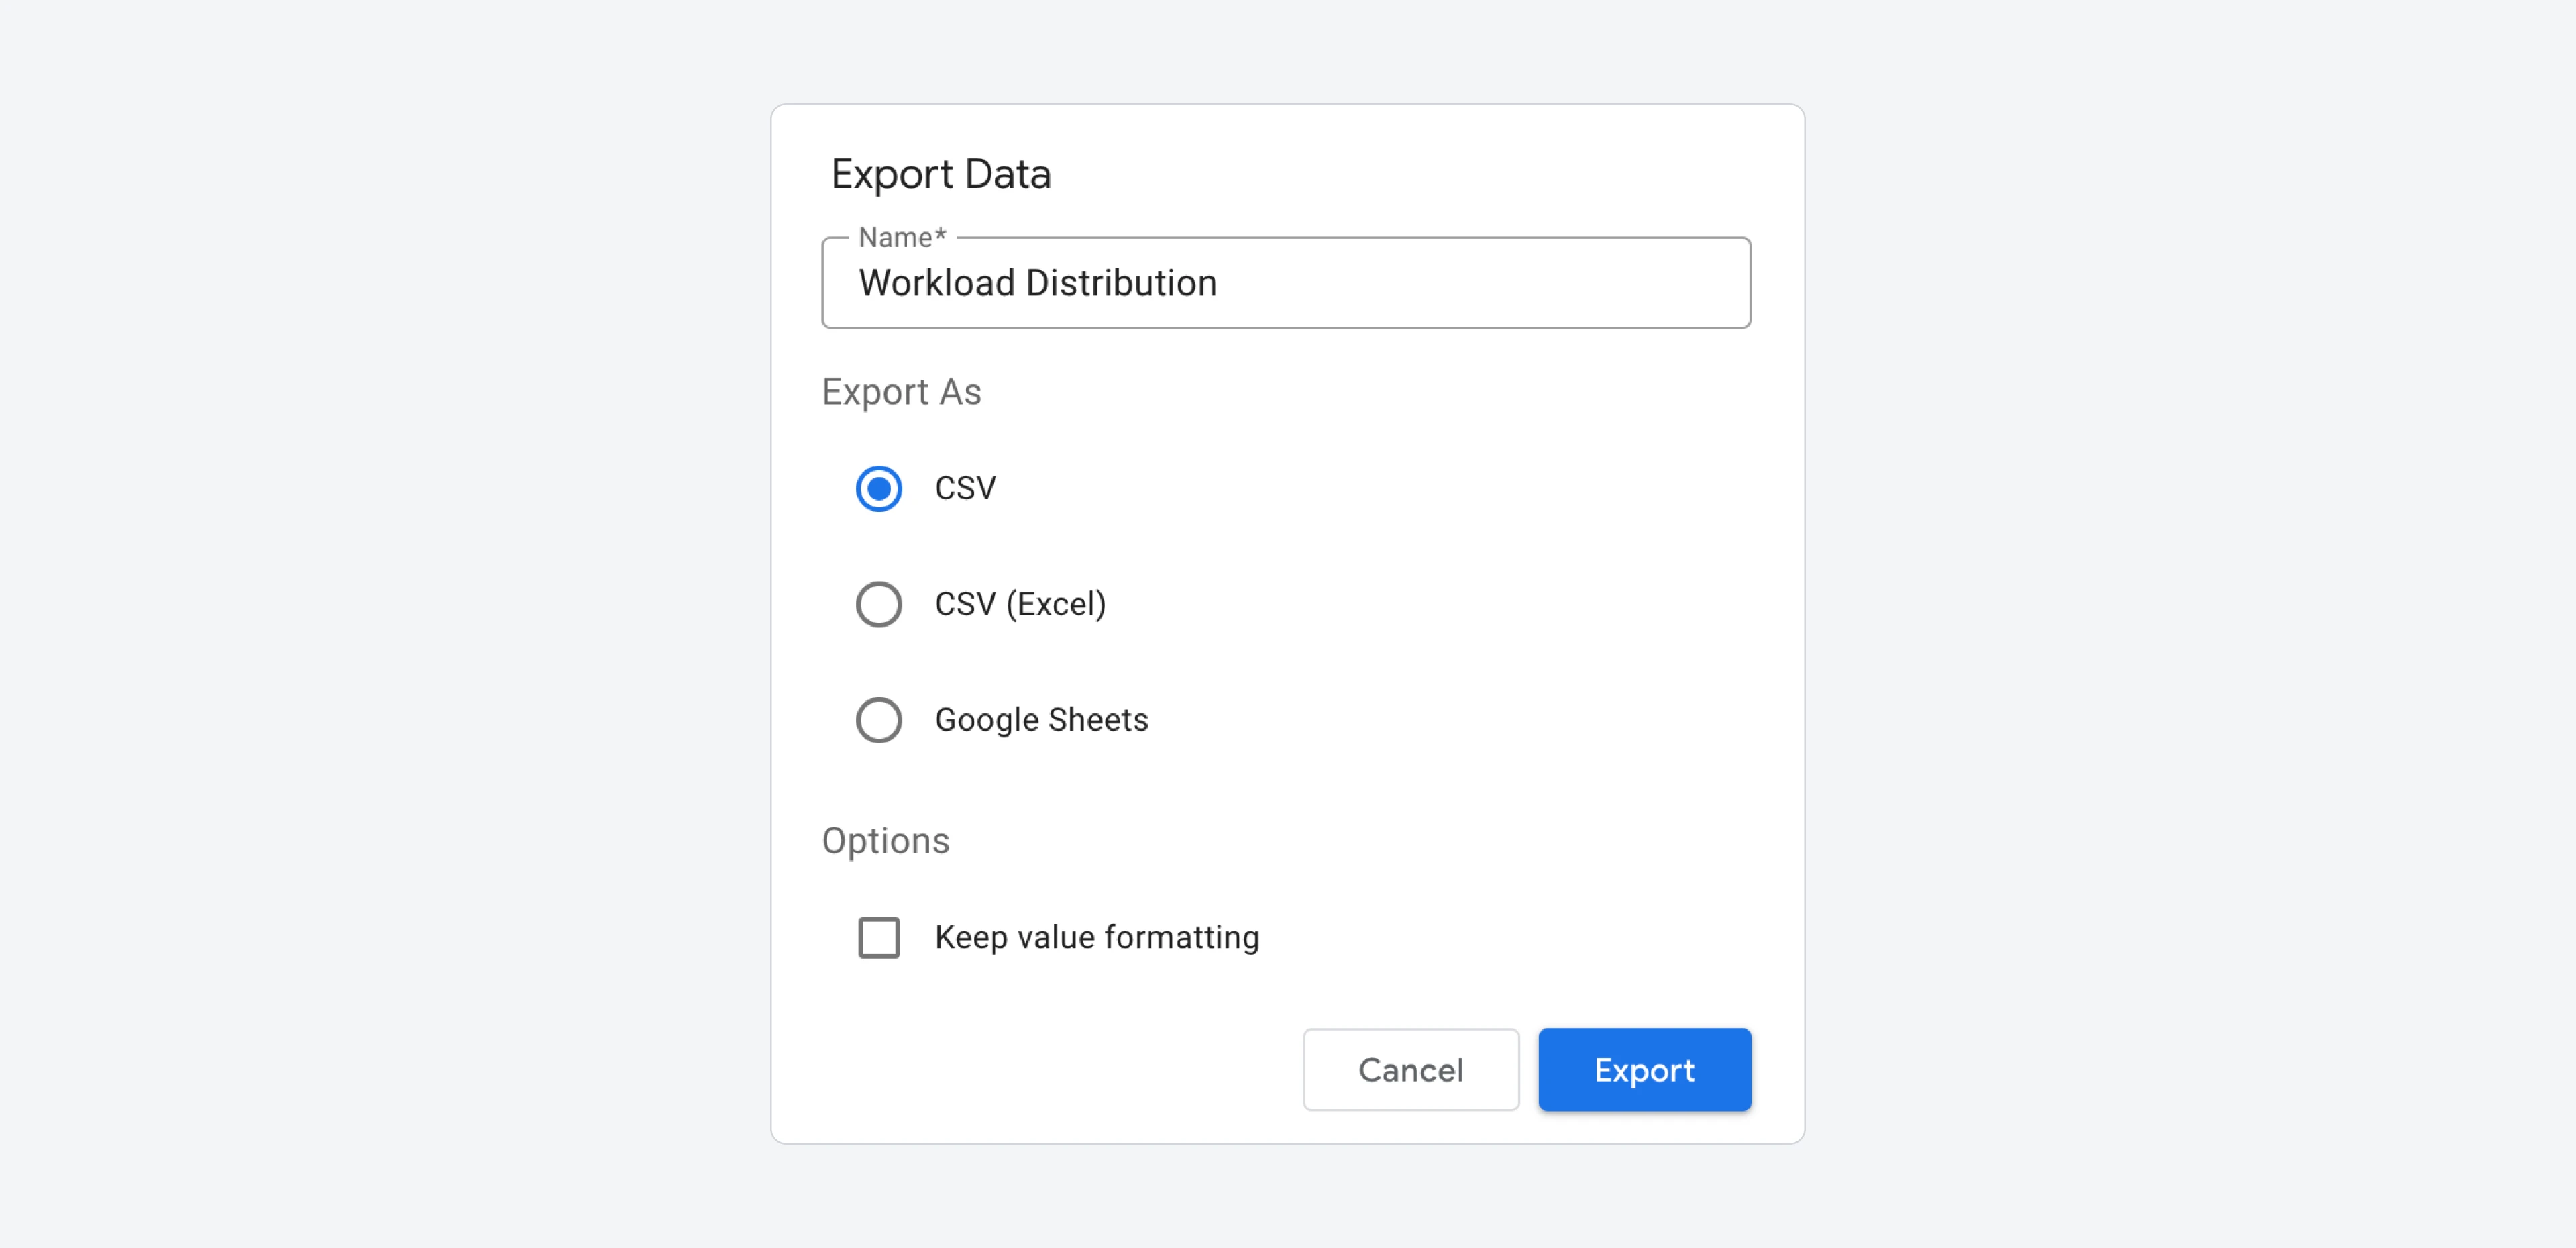
 Then, a modal will open where you can name your file and choose the format you need (CSV, CSV prepared for Excel, or Google Sheets).
 Any filters and date range settings applied on your dashboard will also be reflected in the exported data.
Export raw email data
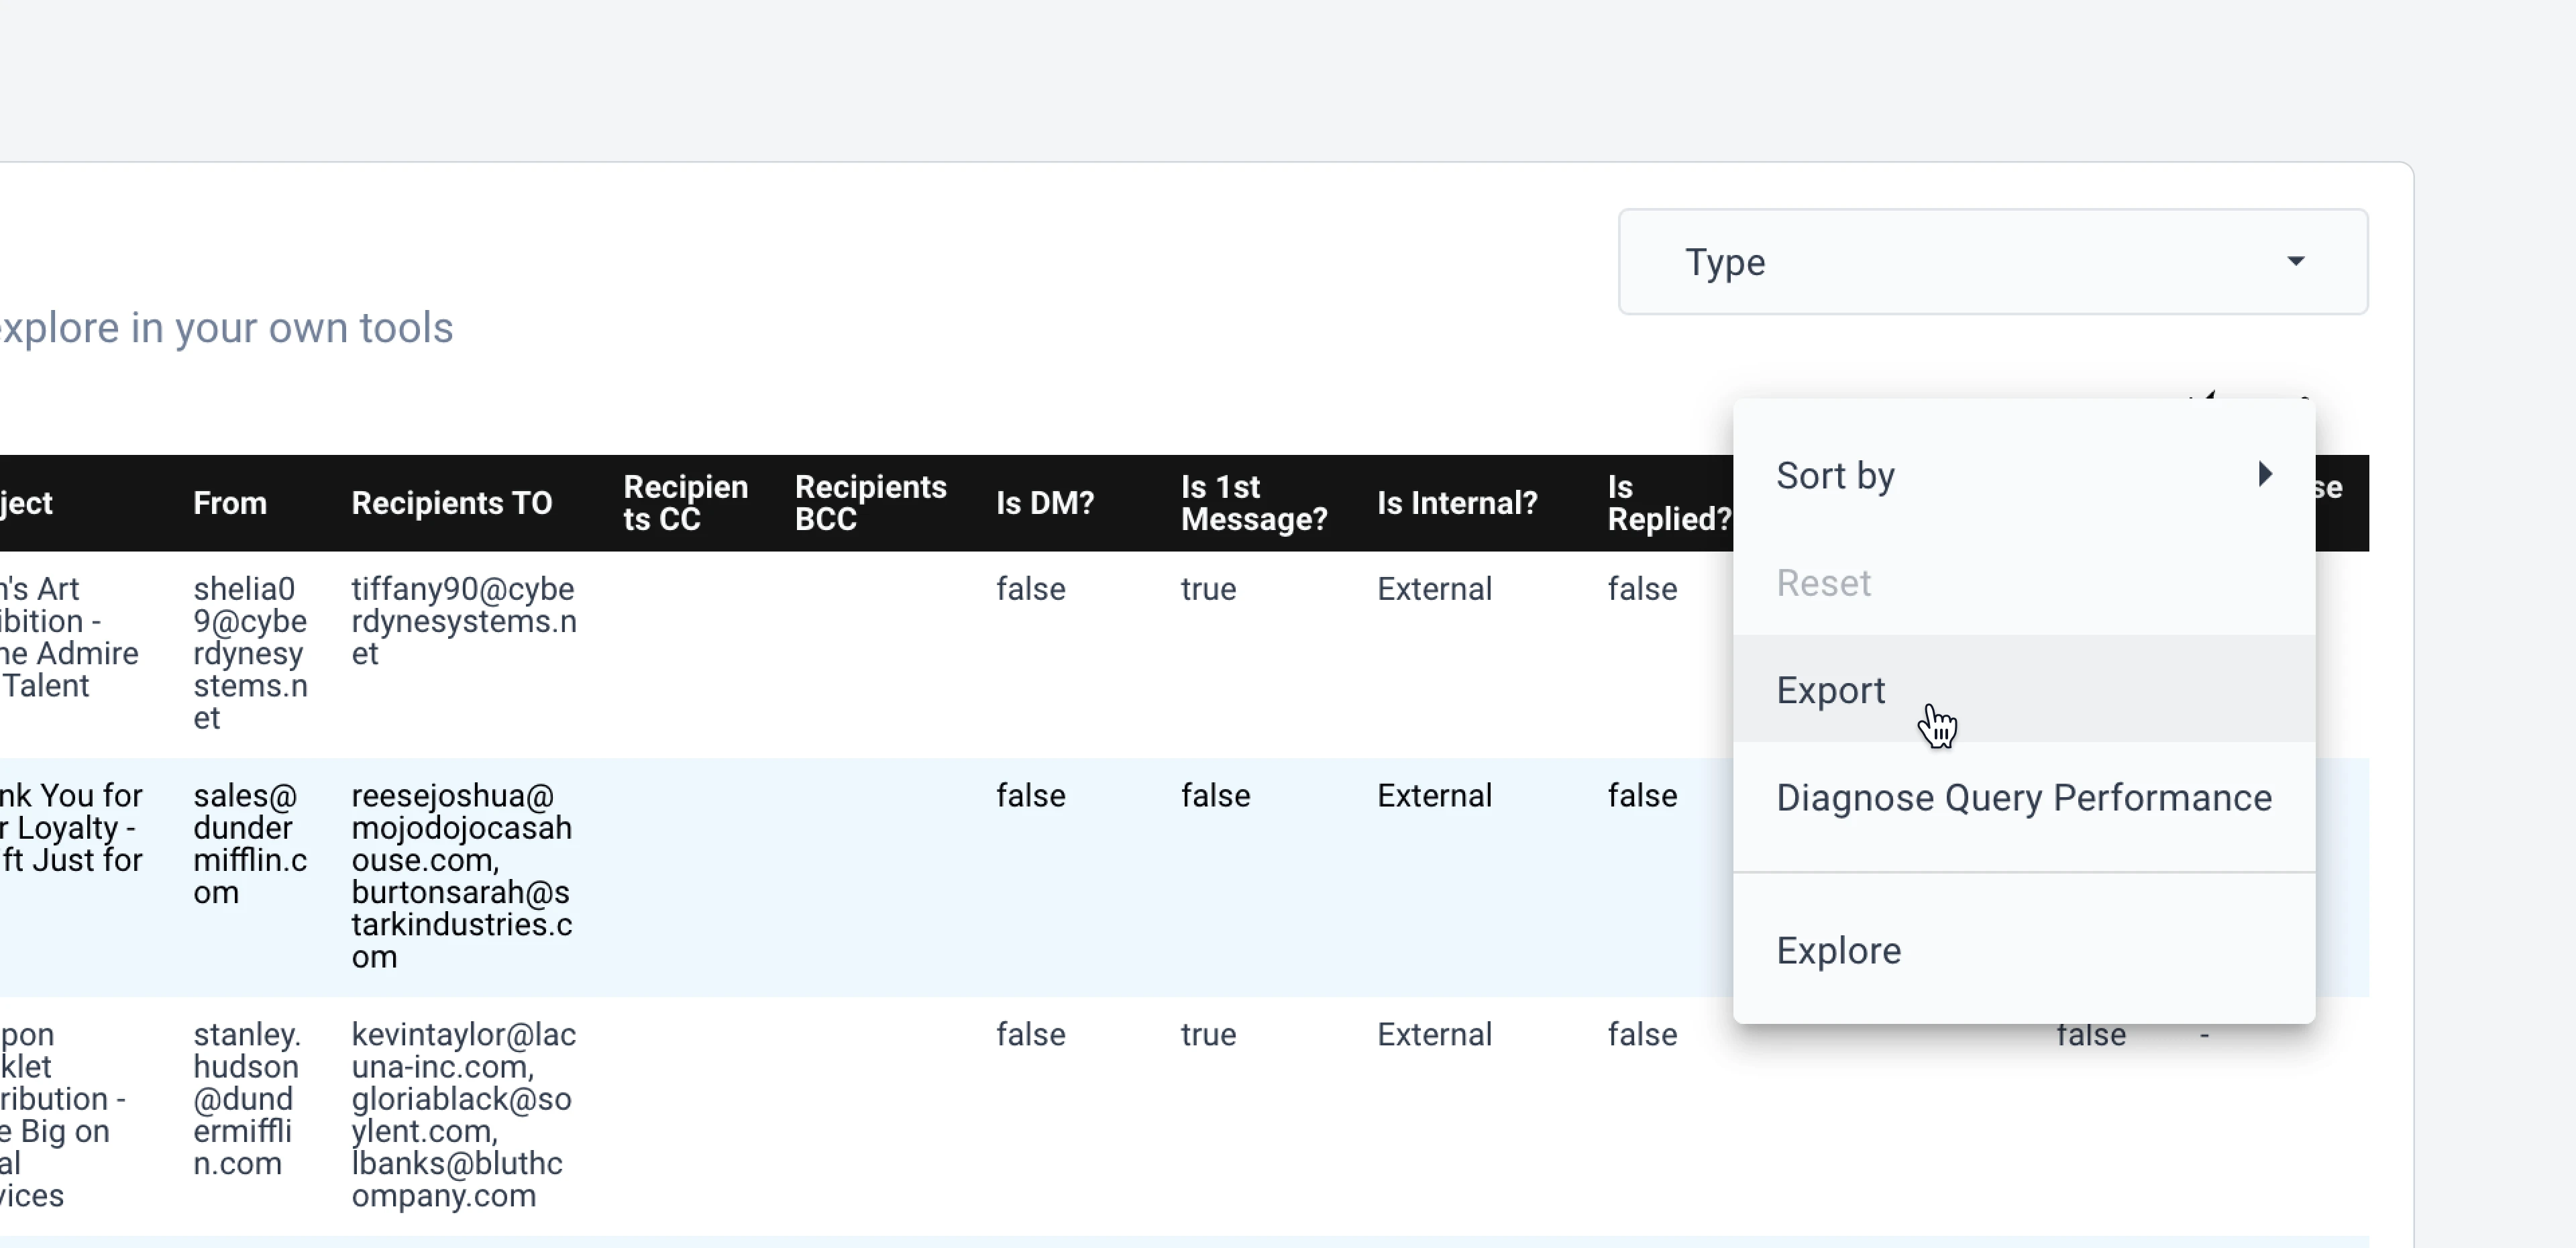
The Raw Data Export feature is the best option if you want to calculate your own metrics. It allows you to export individual emails with the necessary data fields to calculate other metrics such as email volumes, average response times, and more. To use this, go to the Raw Data Export page on your email analytics dashboard, set your desired time range, and apply filters you want. After adjusting these settings, find the table, click on the... icon, and select Export.
 You will then be able to choose from different export options, including CSV, CSV prepared for Excel, or Google Sheets.